The Vegas Dashboard helps users get a good idea of which games or teams to target on a slate. There are a handful of different numbers shown on the page and colors that correspond to those numbers.
Here's what you need to know about each of the columns on the page.
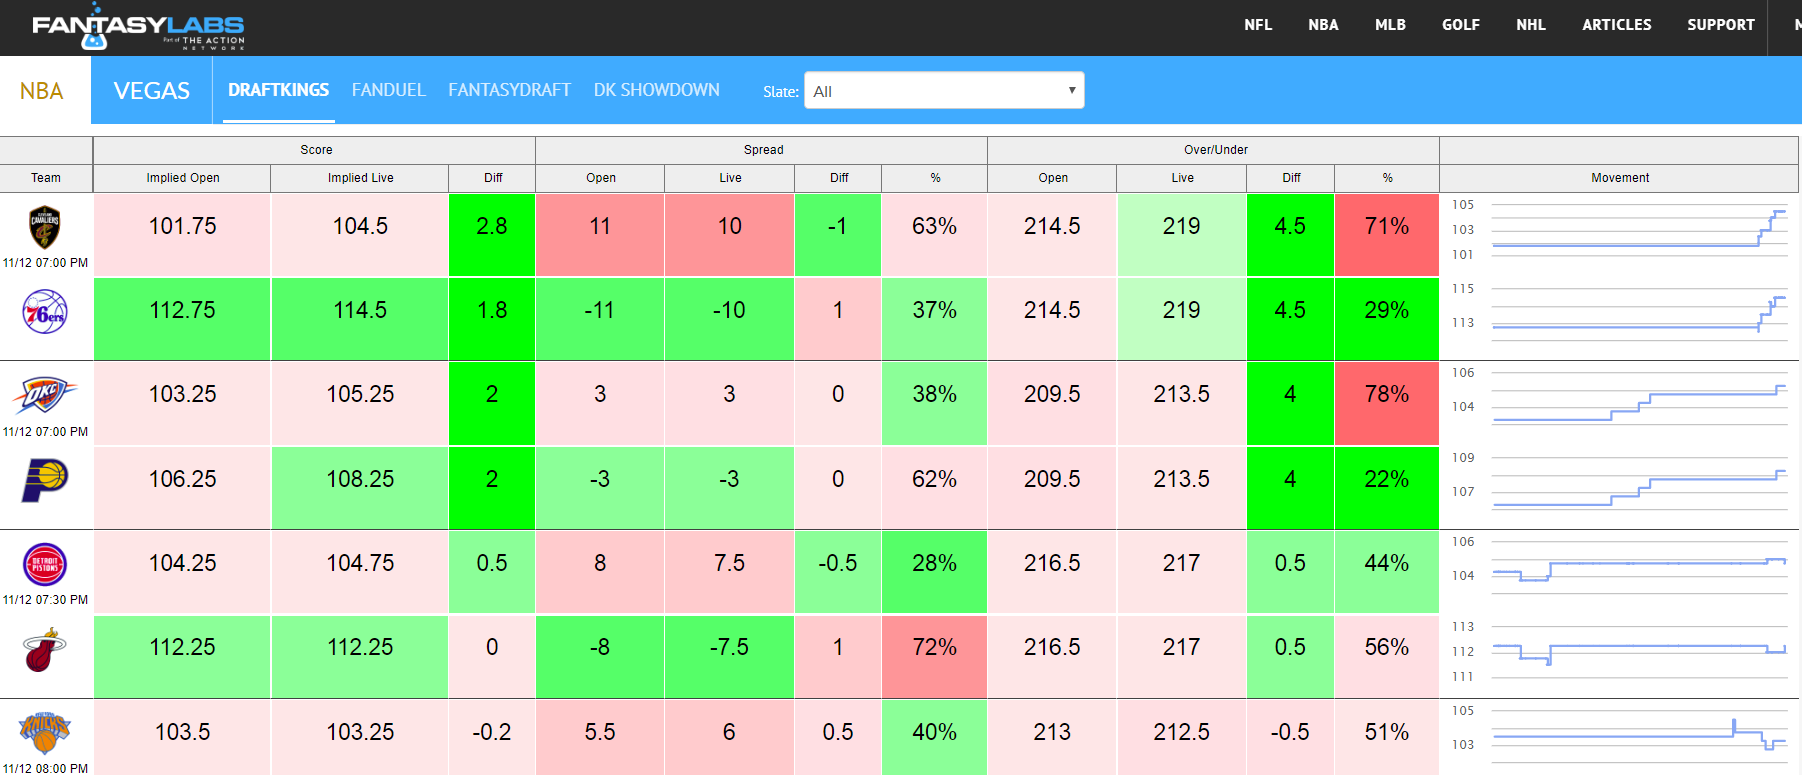
Open/Live: 'Open' for each section is referring to the opening Vegas line, and 'Live' is the current Vegas line. Unlike DFS prices, betting lines fluctuate based off of betting activity and injury news.
Implied: Implied totals are calculated by looking at the spread and over/under for a game. For example, in the Cavs-76ers game in the top of the picture, the 76ers are favored by 10 points and the total is 219. If you do out the math, Vegas is estimating Philly to score 114.5 points and Cleveland to score 104.5 (114.5+104.5=219, 114.5-104.5=10).
Spread: Betting spreads are the numbers Vegas uses to handicap games. Teams with a minus sign in front of their spread are favorites and teams without a minus sign are underdogs. For example, the Cavaliers are 10-point underdogs against the 76ers, which is a fairly large spread for the NBA. Philadelphia bettors would need the 76ers to win by at least 11 points to cash their tickets.
Over/Under: The over/under in a game is the estimate for how many points are expected to be scored by both teams combined. Games with higher over/unders, also known as totals, are likely to see more points and therefore more DFS points. In 2019, the average over/under is around 220 points. This is higher than several years ago when paces were slower and less three pointers were shot.
Dif: These columns are referring to the differential between the opening numbers and the live numbers. If an over/under is dropping, that either means sportsbooks are getting influential action on the under or there's been an injury to a key player. If a team is favored by more than they were at opening, that could mean sharp bettors or a large percentage of the public is betting on them.
%: These columns refer to the percentage of bets that team or over/under is receiving. For example, Detroit (+7.5) is getting just 28% of spread bets compared to Miami's 72%. The over in that game is getting 44% of bets compared to 56% on the under.
Movement: The movement charts help show the timeline of how a team's implied total has changed since lines opened. For example, both Cleveland and Philadelphia's implied totals went up rather rapidly thanks to the over/under rising by 4.5 points since opening. On the other hand, Detroit and Miami's implied totals have gone back and forth a bit since opening.