Our innovative Player Models tool is completely customizable, allowing you to weigh a variety of stats as you see fit, backtest how well the combination has worked in the past, and ultimately create extremely accurate, powerful player ratings that update in real-time. Follow along for more information on how to get the most out of Player Models.
1. Creating a Model
To create your own personal, fully customizable model, first select the drop-down arrow located beside “Open” at the top of your screen.
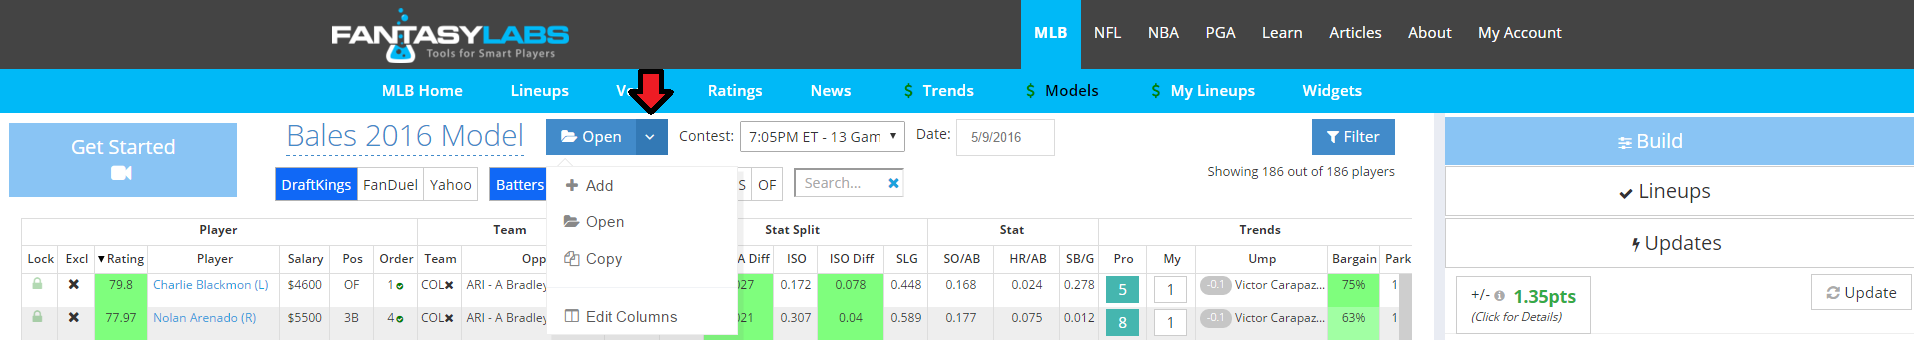
From there, select “+ Add,” which will generate a pop-up screen. This is where you name your personal model.
As you will see, there will be no player ratings and the Plus/Minus on the right will say 0.00.
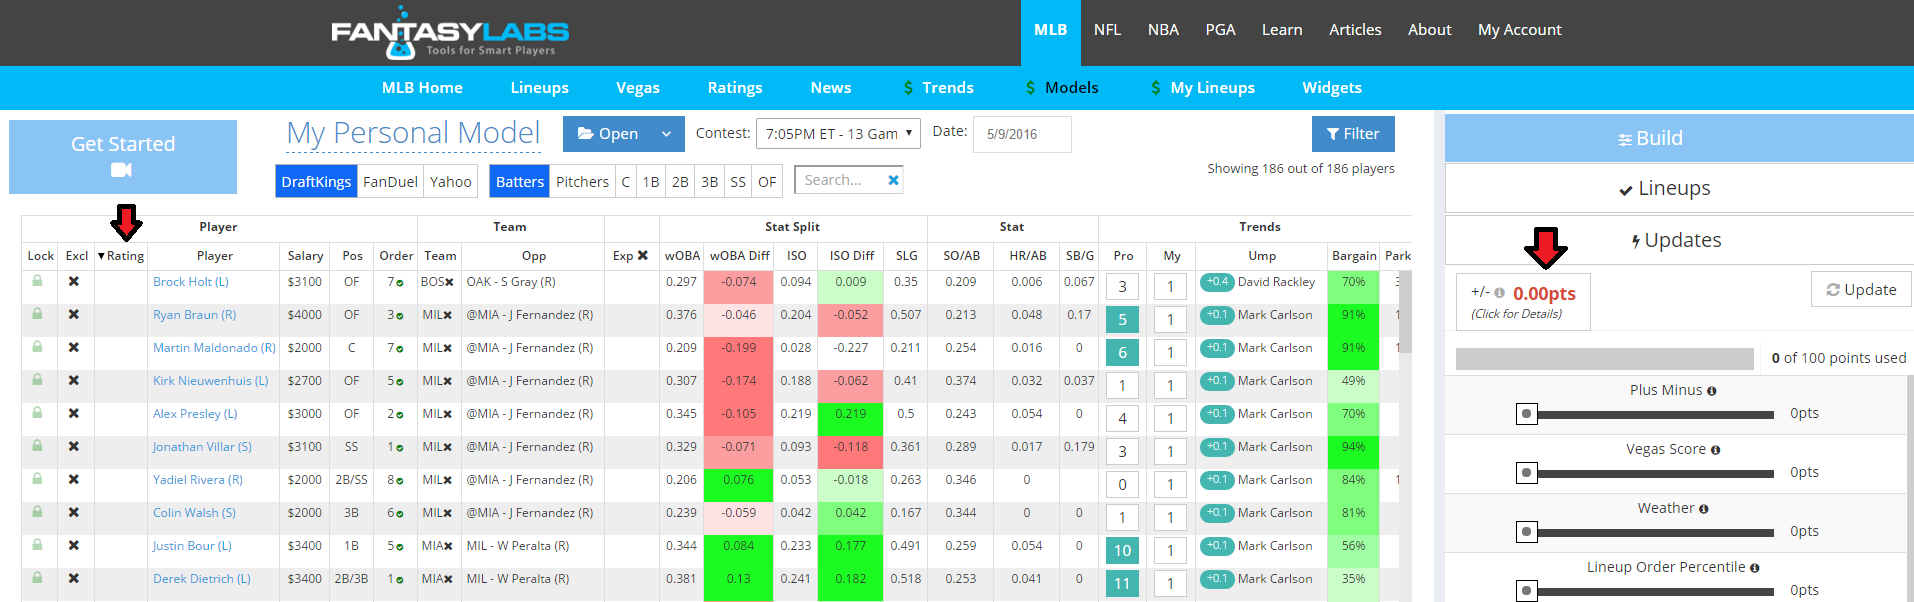
This is what makes FantasyLabs models so unique. Player ratings are generated by your personal weighting of a variety of factors, as shown on the right – (Vegas Score, Lineup Order Percentile, Park Factor, and much more).
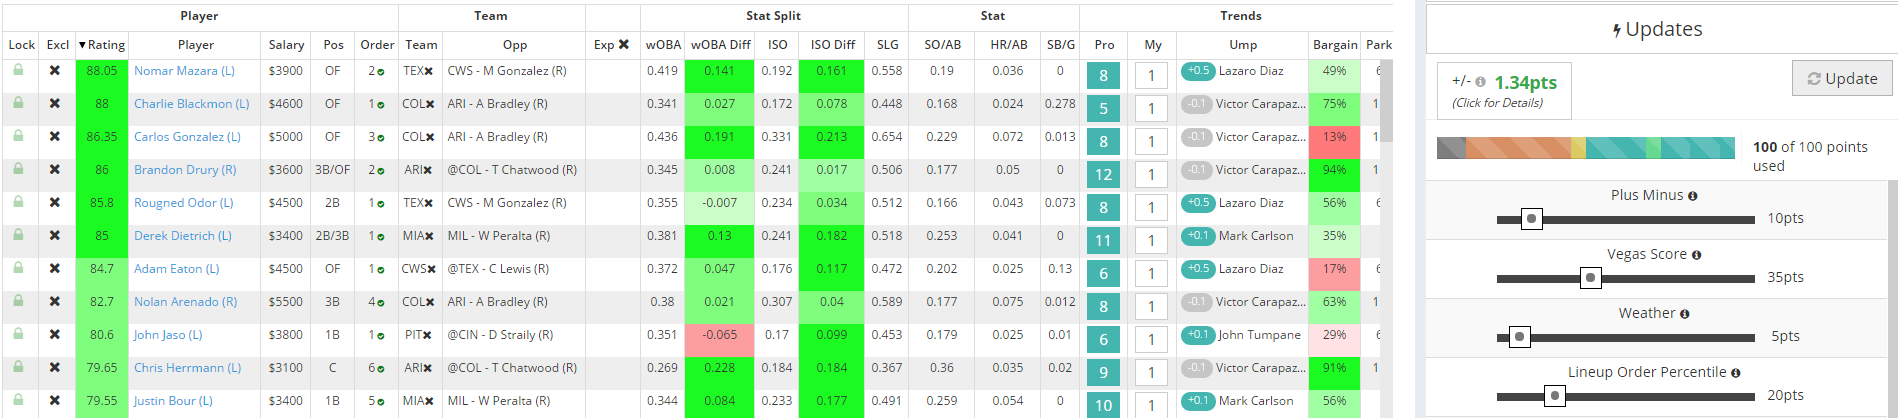
To generate player ratings on the left, adjust the sliders on the right to where you want them (you have 100 points to “spend”), then click ‘Update.’ From there, your model will update player ratings based on the weights you’ve given. The overall historical Plus/Minus rating of the model will show up on the right above the weights as a way to immediately grade the effectiveness of your model. Basically, we tell you in an instant if your model would have won in the past.
You will need to repeat this process for each position, depending on the sport (batters, pitchers, QBs, RBs, etc.) and each site (DraftKings, FanDuel, or Yahoo).
2. Pro Models
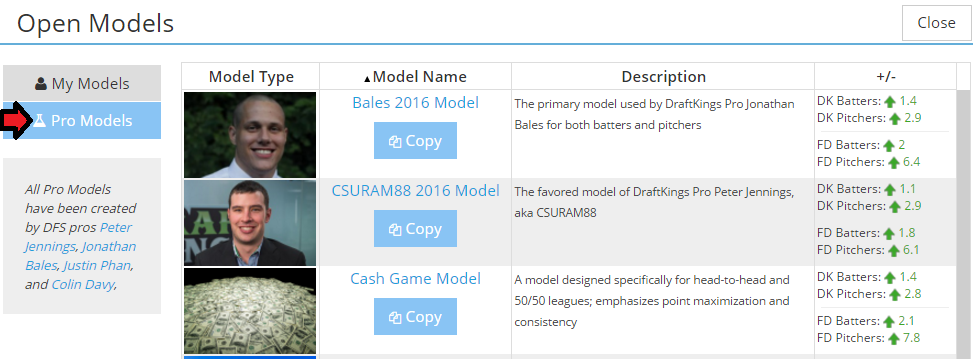
If you would prefer to use one of the Pro Models we have developed, you can simply add one. To do this, select “Open” at the top of your screen.

Clicking “Open” will generate a pop-up window. Select “Pro Models” and find a model that suits you. Once you find one you like, click “Copy” under the model name and it will populate into your model screen.
From there, you can use the Pro Model as it comes, or, as we suggest, adjust the sliders as you wish. Once you adjust sliders and hit “update,” the changes will stay, but you can always re-copy the Pro Model again to find the initial model weights.
3. Advanced Data and Unique Metrics
Plus/Minus is a unique FantasyLabs metric that is at the core of all of our tools. It is defined as actual fantasy points minus expected fantasy points based on salary. This distinction is important, as daily fantasy sports are played with a salary cap. We can only really know a player’s value when we measure his fantasy production in relation to his price.
As an example, a $5,000 batter on DraftKings might be expected to score 8.0 points. If he scores 10.0 points in a game, he’s turned in a Plus/Minus of +2.0. Plus/Minus is a way to put every player on an even playing field using historical salaries and performance data—something other sites cannot do.
As you can see, we integrate Plus/Minus into our models in a variety of ways:
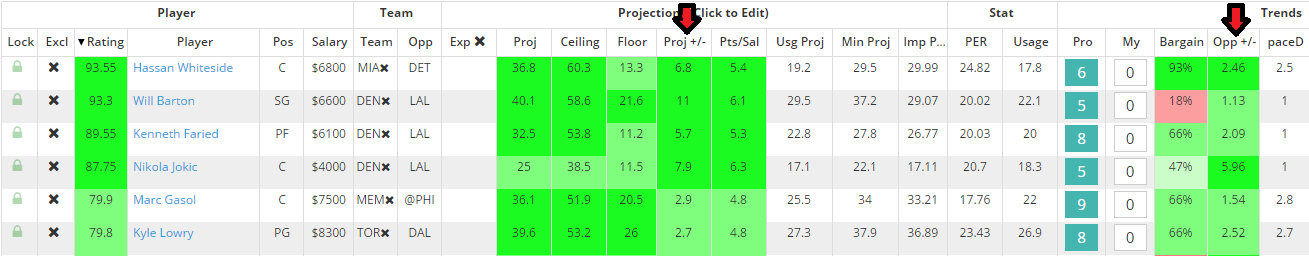
Although we have fantasy point projections (for NBA and NFL) for each player (the second green column), we also have Projected Plus/Minus – their projection minus their expected fantasy points based on salary – and Opponent Plus/Minus, which is the Plus/Minus the opponent allows to a player’s position.
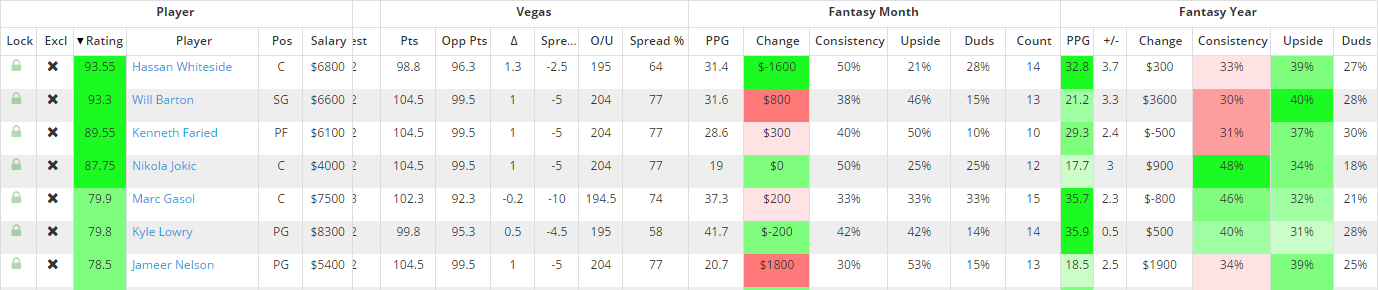
At the far right of each sport’s model, we have Consistency, Upside, and Dud percentages. These are also unique FantasyLabs metrics, defined as the percentage of games a player has matched or exceeded their expected points, the percentage of games a player has been one-half of a standard deviation above their expected points, and the percentage of games a player has been one-half of a standard deviation below their expected points, respectively.
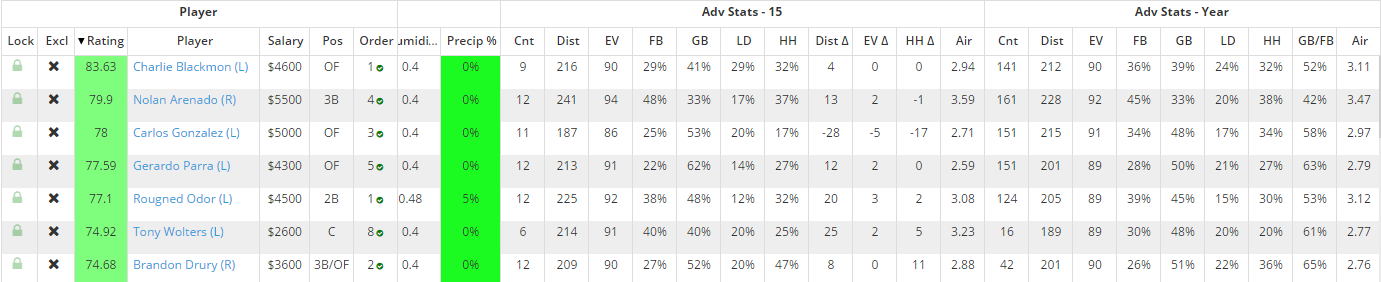
We also have premium advanced statistics in our Player Models. For example, in our MLB models, we list recent (running 15 days) and year-long data for batted-ball distance, velocity, hard-hit percentage, air time, groundball percentage, and more.
4. Tips and Tricks
Tip 1: Excluding players and teams
To exclude players or whole teams from your model, simply click the “X” next to their name or the “X” beside their team name, respectively.

If you want to add removed players back to your model, select “Lineups” on the right-hand side of the page, click “Excluded Players,” and then click the left arrow.
Tip 2: Viewing the historical performance of your model
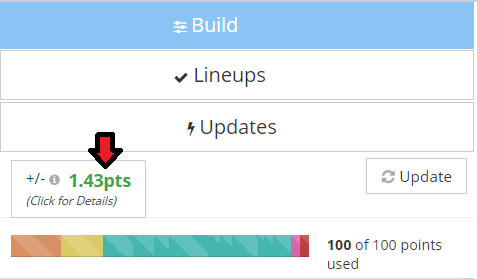
To view the historical performance of your model, click on the Plus/Minus on the right-hand side of the model page.
This will generate a pop-up window, which will show you the historical Plus/Minus percentiles for your model.

The “R2” number at the top right measures the correlation between the model’s player ratings and historical Plus/Minus. For reference, 0 means no correlation, while 1 means perfect correlation. The higher the correlation, the surer you can be that the players rated highly in your models will generate value.
Tip 3: Using team filters
To filter your models to specific teams, select “Filter” at the top of your screen.

This will generate a pop-up window that will allow you to filter down teams for your model.
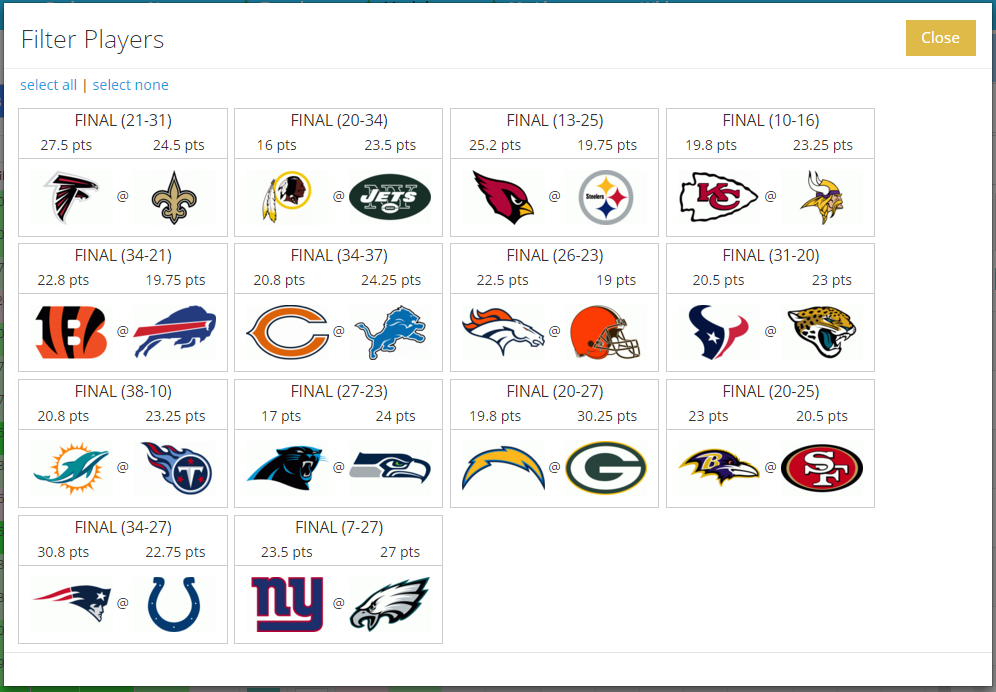
It’s important to note that this function doesn’t exclude anyone from your model, but rather simply removes them from your view.
Tip 4: Viewing past and future dates
To change the date of your model, simply select the date box at the top of your screen. You can always go back to past days, re-optimize lineups, and do research.

Tip 5: Keep up with news as you build lineups
Don’t worry about missing any pertinent updates or news while you build your lineup. We will alert you with any current news, and you can view it by selecting “Updates” on the right-hand side of your screen. We will even auto-update projections in real-time in concurrence with incoming news.
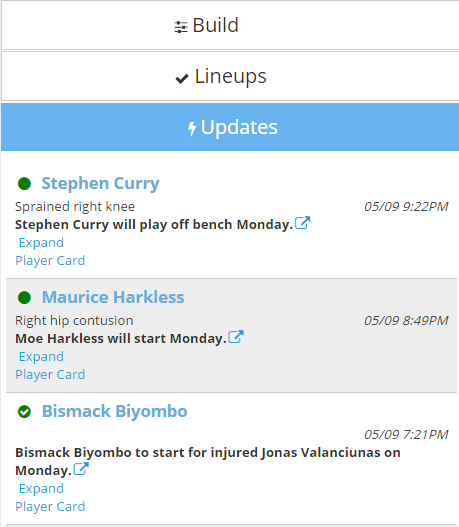
For example, when the Vegas lines move, a baseball team changes their lineup order, the wind picks up on a golf course, or there’s a late scratch in NBA, your model will adjust in real-time to reflect these changes in information.
Tip 6: Reading Player Cards
To bring up a player card, simply click on a player’s name. This will generate a pop-up window of the player card, which has Plus/Minus graphs, premium data, and percentile ratings.
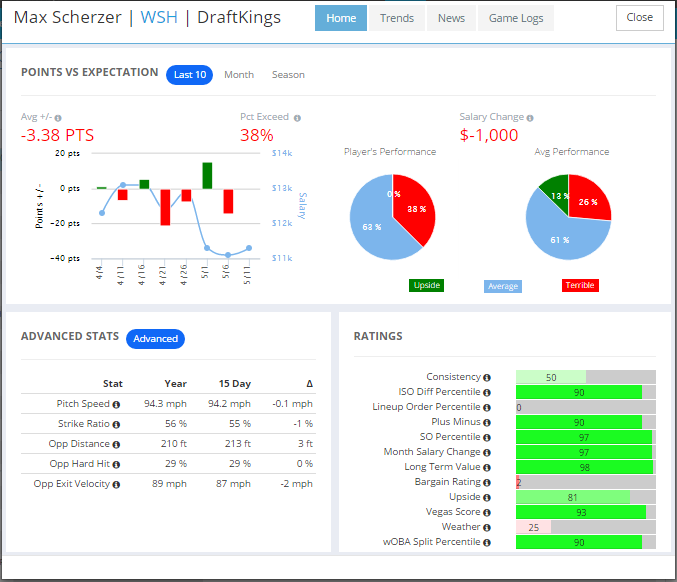
The player cards are completely interactive. The graph at the top left shows the Plus/Minus versus salary for a player over his last 10 games. To see the same data for the last month or even full season, select “Month” or “Season” located beside “POINTS VS EXPECTATION.”
The Ratings on the bottom right are percentile ratings for each statistical category measured. For example, we see that Max Scherzer has a 93 Vegas Score for this day’s slate, meaning the opposing team’s implied run projection ranks in the bottom 7 percent historically.
You can also select “Trends,” “News,” or “Game Logs” at the top of the player card to view those pages of the player card.
Finally, by clicking on the team name next to the player’s name, you can see Vegas data for that day’s matchup.
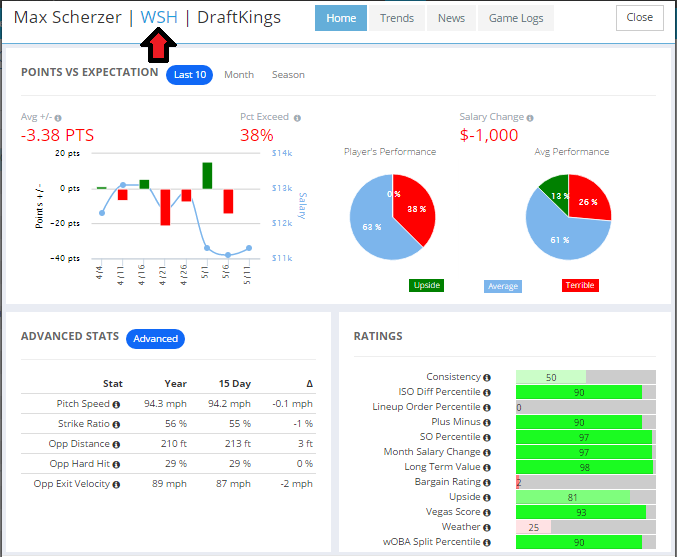
This will generate a pop-up window that shows Vegas information that updates throughout the day in real-time. The graph below shows any movement as well.

If you’d like to see this information in chart form for all matchups on a slate, select “Vegas” at the top of your page.
